I got stuck into learning how opengl works over the last week. Thankfully, I wasn’t alone on this endeavour. Pat managed to help me a few times when I got confused for stuck. So thanks for that Pat!
I followed along the tutorials on open.gl. I decided to use SDL for creating the window and opengl context and glew to obtain all the function pointers needed for opengl. Unfortunately, I had more trouble setting up SDL and glew than I would like to admit. I downloaded SDL and set up the lib and include folder. I linked them within Visual Studios and I was getting linking errors. After a little looking through the lib folder, I realised I set the additional dependencies to SDL.lib and SDLmain.lib when they actually needed to be SDL2.lib and SDL2main.lib. No biggie, I found the problem fast enough. However, the next problem stumbled me a lot more. I knew I needed to move the dll files into the project directory, but for some reason, it didn’t work like it normally does. Normally I can place the dlls next to the .vcxproj file and Visual Studio will have no issue finding it. However, this time to run it in VS I had to add them to both the Release and Debug folders. I placed these files around everywhere and eventually it worked. Now I know for future reference how to solve this issue and where to put the files.
GLEW was also a bit of an issue. Not as big of an issue, but I still ran into one problem. When I set all this up, the glew website was down for maintenance. Luckily, I already had the files downloaded from when I used them a couple of months ago. So I put all the files needed into the include and lib directors, move the dlls into the Release and Debug folder and set the Dependencies of glew32.lib. However, it was still having issues. I spent a few minutes looking through all my settings and checking the files were in the correct folders and then I remembered I needed to add the dependencies opengl32.lib. Once I added that, it finally built and I had a black window that stayed open for 1 whole second and then closed. Progress was made.
I followed along and I learnt how to make an opengl context, initial glew to get opengl function pointers, and create the Vertex Buffer Object. I even understood a large proportion of how the rendering pipeline works. Then I got to shaders… The tutorial is a little vague here, as they never talk about the most popular ways of writing shaders, and they didn’t really explain you have to parse the shader. I decided I want to have .shader files (because they sound cool) with both the vertex and fragment shader in one. The way I establish where the vertex shader and fragment shader start is with #vert and #frag at the beginning of the shader.
My parser went through a few iterations, starting with it opening the file, looping through it line by line, checking if the line contains #vert or #frag and then adding the lines to the specified shader source. However, this wasn’t really a good way of doing it as it was potentially doing two finds each line of the file. The final iteration is it’s own class that has a shaderId which is just the program GLuint. It loads the whole file into memory then does 2 finds to find the position of #vert and #frag. Once they have been found, the source is created by getting a substring between the opening tag and the next tag (or the end of the file). This way there only needs to be 2 finds instead of a potential of 2 each line. In my shader class I made a large mistake which actually effected the end result not rendering. But more on that a bit further down.
Next I learnt about setting attributes for the shader and uniforms. These were simple enough as I understood the concepts from using shaders within Unity before. This is where I ran into one of the large problems. I was creating the Vertex Array Object but it was crashing everytime. I tried moving the code around and still nothing. It turned out I had to do glewExperimental = true before I initiated glew. It appears that not everything is set up unless you have that line. Once that was done, I thought it was all good, I ran it and … nothing. To be expected. Now I will outline the other issues I had.
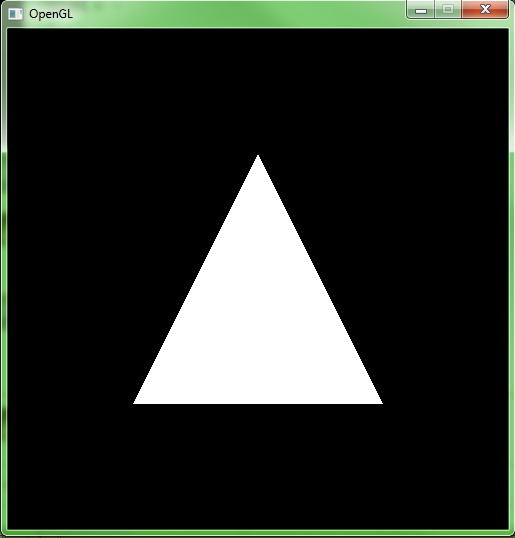
In my shader class, for the fragment shader, I forgot to change it glCreateShader(GL_FRAGMENT_SHADER); I left it as GL_VERTEX_SHADER for the fragment. The next issue was a silly one. When I was drawing the rectangle, I wrote the code on the wrong line and it was just outside of the core loop. Oopss. I picked up on that one fast luckily. The last major issue was I forgot to enable the program. I knew I had to do it too because I created functions in the Shader class to enable and disable. I just forgot to call it. Once that was all done, it finally drew a triangle. I was so happy because in totally this took me about 8 hours to write and understand what was going on. I didn’t want to just copy paste code, I wanted to actually understand. And I can say, I understand a lot more than I did before. Obviously it didn’t ALL stick the first time, but continuous use will help with that. I also changed the color uniform to be a random colour each update… so that looks cool. Anyway, here are my precious pictures: